Graph Visualizer
Visually explore and interact with your ArangoDB graphs through an intuitive interface
ArangoDB Platform
The Graph Visualizer is a browser-based tool integrated into the web interface of the ArangoDB Platform. It lets you explore the connections of your named graphs to visually understand the structure as well as to inspect and edit the attributes of individual nodes and edges. It also offers query capabilities and you can create new nodes (vertices) and edges (relations).
You can use the Graph Visualizer to do the following:
- Filter and view specific nodes to focus on a subset of your graph.
- Dynamically expand nodes to show more of their neighborhood to see how entities are connected.
- Inspect the properties of nodes and edges.
- Modify existing or create new nodes and edges.
- Rearrange nodes automatically or manually for better visual clarity.
- Use zoom and pan to explore large graphs more easily.
View a graph
The core function of the Graph Visualizer is to provide an intuitive canvas for exploring graph structures. You can visualize any type of named graph (General Graphs, SmartGraphs, EnterpriseGraphs, SatelliteGraphs).
Select and load a graph
- In the ArangoDB Platform web interface, select the database your named graph is stored in.
- Click Graphs in the main navigation.
- Select a graph from the list.
- The viewport of the Graph Visualizer opens for exploring the graph.
The main area of the viewport may initially be empty in the following cases:
- You opened a graph for the first time and nothing is selected for displaying yet
- You used the Clear Canvas option
You can Add nodes to the canvas manually as well as Add nodes and edges using a query. Afterwards, you can also Add nodes and edges using a query based on a selection as well as Remove nodes from the canvas.
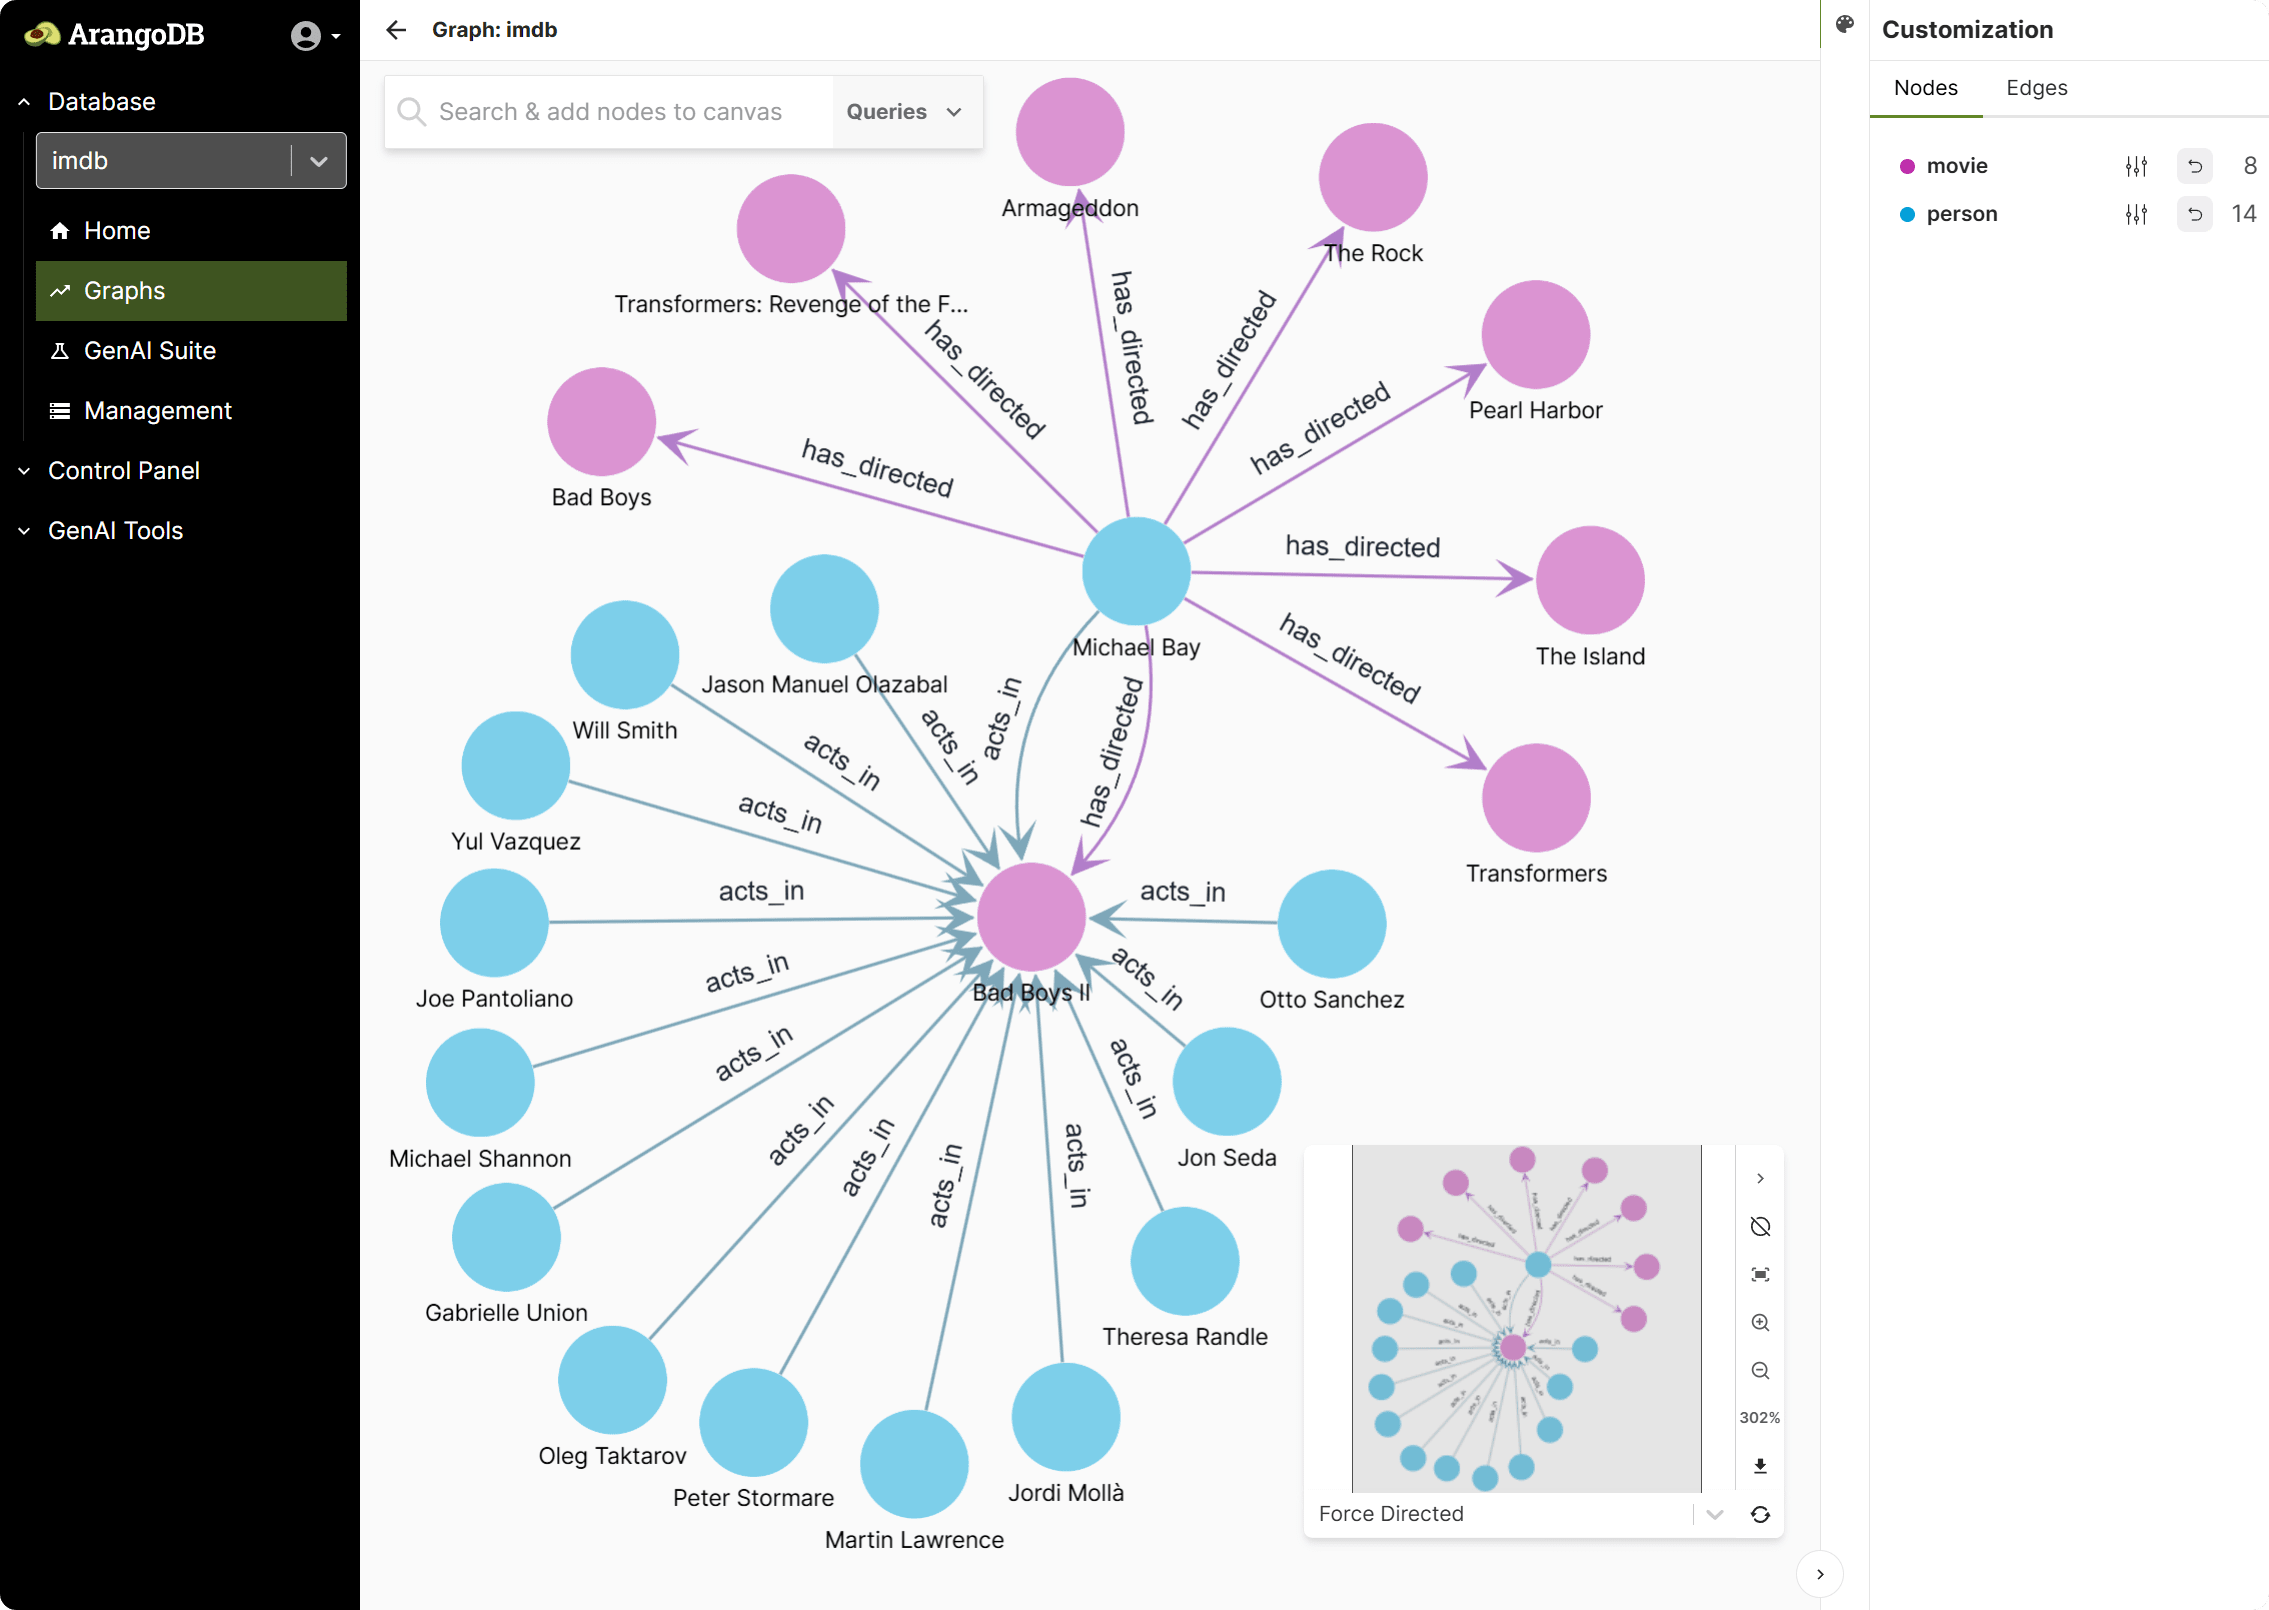
The viewport
The Graph Visualizer interface is comprised of the following components:
- Canvas: The main area of the viewport.
- Search & add nodes to canvas and Queries: A widget in the top left corner that opens dialogs for selecting nodes and edges to display (manually or using queries).
- Customization: A sidebar on the right-hand side to adjust the styling.
- Layout and Navigation: A minimap and multiple tools for the canvas in the bottom right corner.
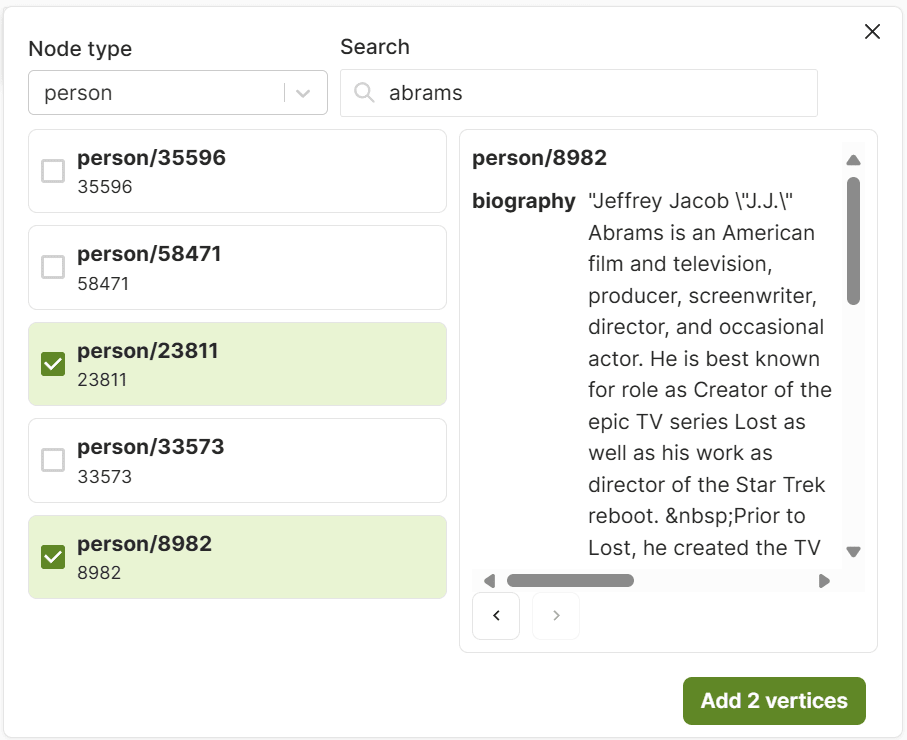
Add nodes to the canvas manually
You can add individual nodes to the canvas in addition to what is already displayed.
- Click Search & add nodes to canvas.
- Select a Node type. This is the name of the collection that stores the node you want to select.
- Enter a value into the Search field. This searches common attributes as indicated by the placeholder text and finds up to 10 nodes that contain this text in one of these attributes (case-insensitive).
- Select one or more nodes from the list on the left-hand side.
- Optional: You can check the attributes of the selected nodes on the right-hand side. Use the buttons at the bottom to switch between nodes.
- Click Add n vertices.
- To see the neighbor nodes and the edges that connect them, right-click a node, click Expand (n) and then All (n).
Add nodes and edges using a query
You can run an AQL query to add a nodes, edges, or paths of the graph to the canvas.
- Click Queries of the top-left widget.
- Click New query.
- Enter an AQL query that returns nodes, edges, or paths
(e.g. a graph traversal query), for example:
FOR node IN coll LIMIT 10 RETURN node // [ { "_id": "..." }, ... ]FOR edge IN edgeColl FILTER edge.value > 10 RETURN edge // [ { "_from": "...", "_to": "...", "_id": "..." }, ... ]FOR v, e, p IN 1..3 ANY "coll/753" GRAPH "myGraph" RETURN p // [ { "vertices": [...], "edges": [...] }, ... ] - Click Run query. Depending on what the query returns, either only nodes or edges with their nodes appear on the canvas, in addition to what is already displayed.
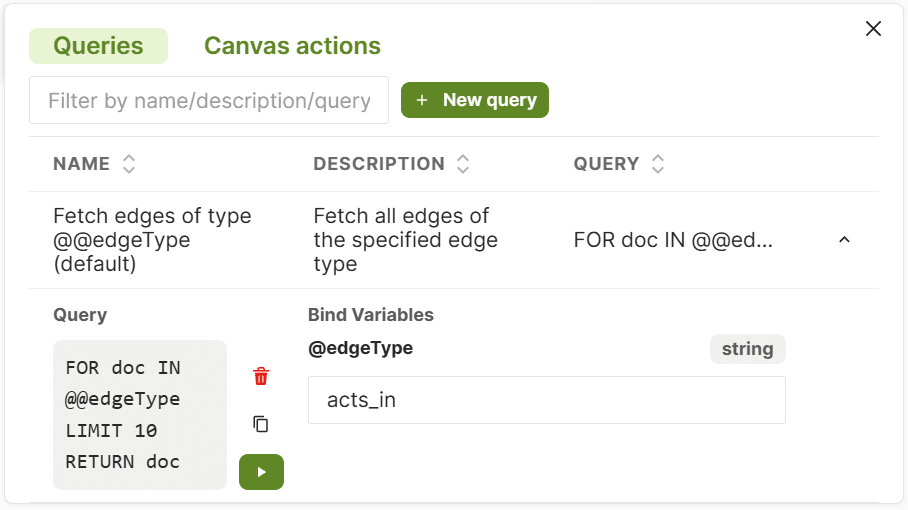
You can save queries for future use:
- Click Queries of the top-left widget.
- Click New query.
- Enter or edit the AQL query you want to save. You can optionally use bind variables to parameterize saved queries.
- Enter a name and optionally a description, then click Save.
- To run a saved query, click Queries of the top-left widget.
- Select a query from the list. The following actions are available for each query:
- Bind Variables to set for the query.
- Run the query.
- Copy the query string to the clipboard.
- Delete a no longer needed query.
Add nodes and edges using a query based on a selection
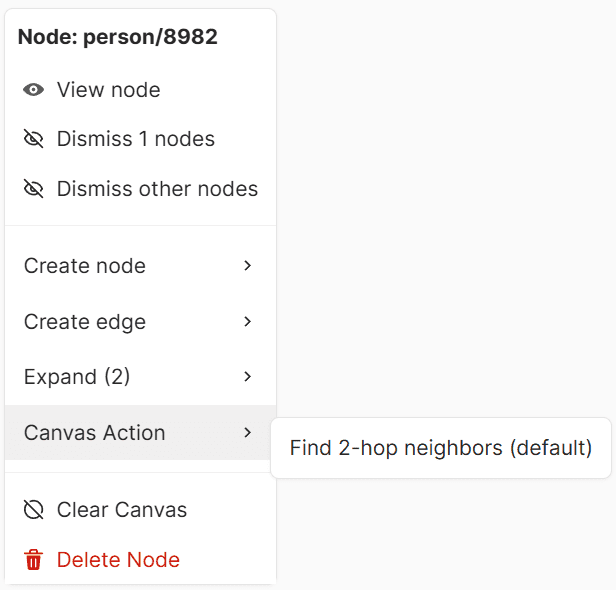
You can select nodes and edges on the canvas and then use a Canvas Action. This runs an AQL query to add nodes, edges, or paths of the graph to the canvas. The query has access to the current selection via special bind variables.
- Create a selection. You have different options:
- Click a node or edge to select only this element.
- Hold the Shift or Ctrl key and click multiple nodes and edges.
- Hold the Shift or Ctrl key and drag the mouse to perform a box selection.
- Right-click the canvas, click Canvas Action, and select a saved action.
- Depending on the query, additional nodes or edges with their nodes are added to the canvas.
- To create a custom Canvas Action query, click Queries of the top-left widget.
- Click Canvas Actions, then New action.
- Enter an AQL query that makes use of the special bind variable
@nodes,@edges, or both and returns nodes, edges, or paths. Examples:FOR selectedNode IN @nodes FOR v, e, p IN 1..3 ANY selectedNode GRAPH "myGraph" FILTER p.edges[*].value ALL < 7 LIMIT 20 RETURN p - Enter a name and optionally a description for the action and click Save.
Remove nodes from the canvas
You can dismiss nodes to show less nodes and edges on the canvas to focus on the relevant parts of the graph at a given time. This only changes what is displayed on the canvas. It doesn’t delete the underlying documents and you can add the dismissed nodes and their edges back to the canvas later on.
- Decide which nodes you want to either dismiss or keep. You can select nodes
in different ways:
- Right-click a single node to select only this node.
- Hold the Shift or Ctrl key and click multiple nodes or drag the mouse to perform a box selection, then right-click one of the selected nodes.
- In the context menu, click Dismiss n nodes to hide the selected nodes, or click Dismiss other nodes to only keep the selection.
- The canvas updates to only display the remaining nodes, with no dangling edges.
View node and edge properties
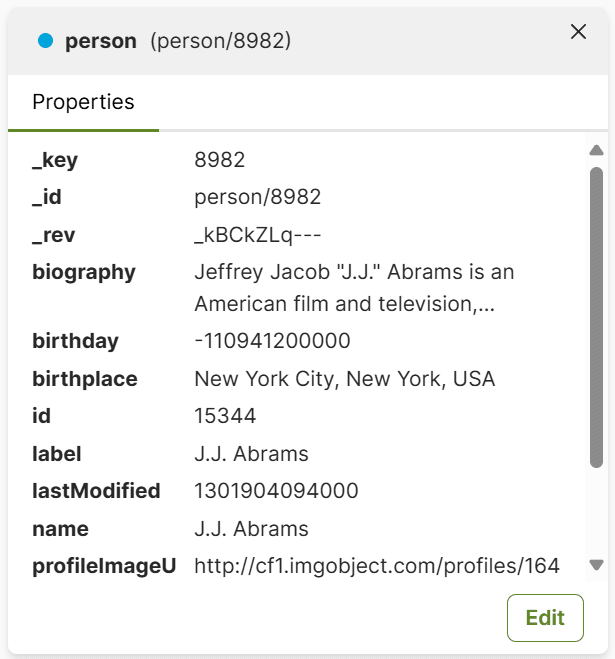
You can inspect the document attributes of node or edge as follows:
- Double-click a node or edge to open a dialog with the properties.
- Right-click a node to open the context menu and click View Node to open the dialog with the properties.
Layouts and navigation tools
These features allow you to clear, zoom, and pan the canvas, as well as rearrange the displayed graph data for a better spatial understanding of node clusters, hierarchies, and relationship flows.
Minimap: A small overview to easier navigate the canvas.
Zoom Controls: Zoom in/out or reset the zoom to 100%.
Fit to Screen: Resize and center the canvas so you can see everything.
Re-run Layout: Automatically rearrange the nodes using the selected algorithm.
Layout Algorithms: Choose between different ways of arranging the nodes. Which algorithm to use depends on the situation and the graph topology.
Edit graph data
While the Graph Visualizer is primarily designed for exploring graph data, you can also create and modify nodes and edges directly from the canvas.
You need to have write access for the database and the collections for this.
Create new nodes
You can add nodes to the graph’s document collections directly from the canvas. This allows you to create additional entities to the graph.
- In the Graphs section of the ArangoDB web interface, select your graph.
- Right-click on the canvas and choose Create Node.
- A dialog opens with the following options:
- Select the target collection (Node Type).
- Optionally specify a unique identifier (Node ID).
- Click Create to add the node to the canvas and database.
Create New Edges
You can add edges to the graph’s edge collections directly from the canvas. This allows you to create additional connections between nodes.
- In the Graphs section of the ArangoDB web interface, select your graph.
- Right-click on the canvas and choose Create Edge.
- In the dialog:
- Select the target collection (Edge Type, which corresponds to an edge collection).
- Set the
_fromand_tofields by selecting the source and target nodes. - Optionally specify a unique identifier (Edge ID).
- Click Create to add the edge to the canvas and database.
_from and _to fields are automatically pre-filled.
You may need to swap the IDs as the order is not based on your selection sequence.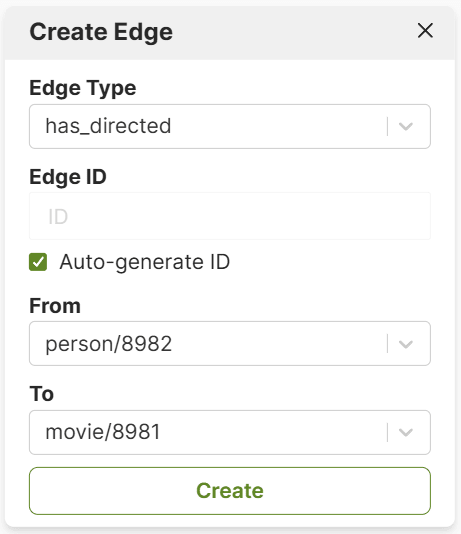
Edit node and edge properties
You can modify the document attributes of nodes and edges from the canvas as follows:
- Double-click a node or edge.
- In the properties dialog that opens, click Edit.
- Change the properties and click Save.
Delete nodes
You can delete individual nodes which deletes the corresponding document.
- Right-click a node to open the context menu.
- Click Delete Node.
- Any edges connected to this node are deleted by default to ensure graph consistency. To keep the edges, untick Delete connected edge(s).
- Confirm the deletion by clicking Delete.
Delete edges
- Right-click an edge to open the context menu.
- Click Delete Edge.
- Confirm the deletion by clicking Delete.
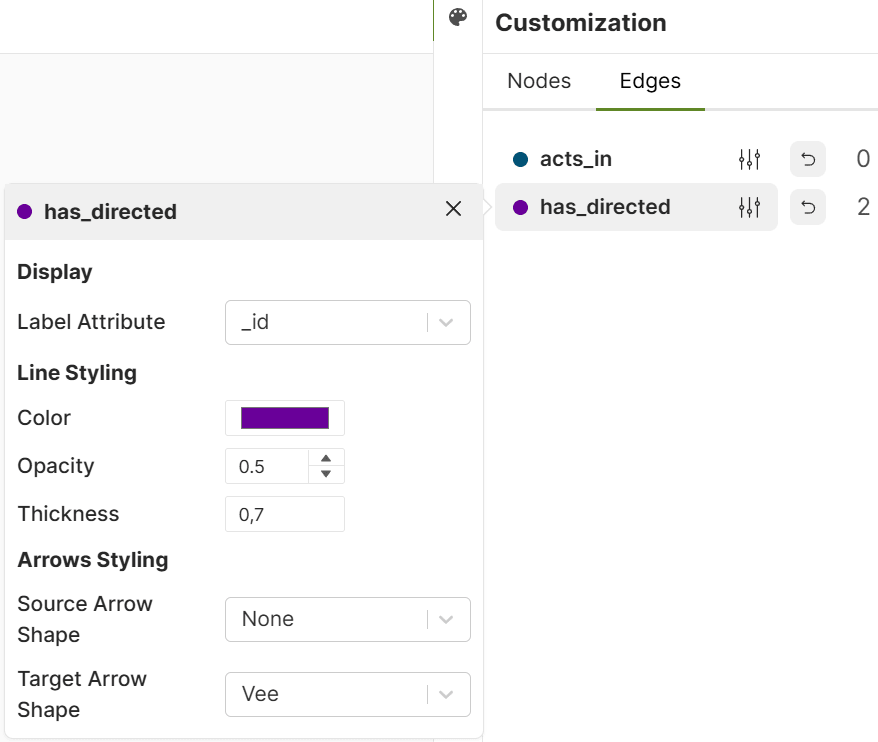
Visual customization
You can adjust how the graph data is displayed, like the color, opacity, and labels. All styling changes are visual-only and do not affect the underlying data.
- Optional: Reset to default styling if desired.
- Click the palette icon in the top right to open the Customization panel if it’s closed.
- Adjust the styling for nodes or edges:
- Select a Label Attribute to display a custom top-level field
(e.g.
nameortype) instead of_id. - Assign a specific Color to highlight and distinguish elements.
- Adjust how transparent elements are with the Opacity.
- Set the Line Thickness (edges only).
- Choose different Arrowhead Styles (edges only).
- Select a Label Attribute to display a custom top-level field
(e.g.
- You can also do the following:
- Clear the styling modifications.
- See the number of nodes respectively edges on the canvas (by collection).